Comet for structured data problems
Most Machine Learning problems fall into the realm of structured data. Comet integrates with a variety of frameworks that were designed to solve this type of problem. For a full list of these integrations, check our Integrations page.
![]()
The following end-to-end example looks at the binary classification problem of Churn Prediction.
Churn Prediction is a common use case in machine learning and involves predicting whether or not a customer will stop using your product. In building such a model, you typically:
- Explore the data.
- Train and evaluate a baseline model.
- Visualize the model predictions and metrics.
We will showcase some of the Comet features that can help you solve strucutured data problems. These include:
- Comet's Dataframe Profiling integration with Sweetviz
- The Confusion Matrix
- Custom Panels for Visualization
We will use the IBM Telco Customer Churn Dataset from Kaggle to build and evaluate our model.
Create an Experiment
The first step in tracking our run is to create an Experiment:
import comet_ml
experiment = comet_ml.Experiment(
    api_key="<Your API Key>",
    project_name="<Your Project Name>"
)
Note
There are alternatives to setting the API key programatically. See more here.
Track and explore the data
Next, we're going to download the data for this example using Comet Artifacts.
This snippet downloads the Churn dataset to our current working directory.
artifact = experiment.get_artifact('team-comet-ml/telco-churn-dataset:latest')
artifact.download('./)
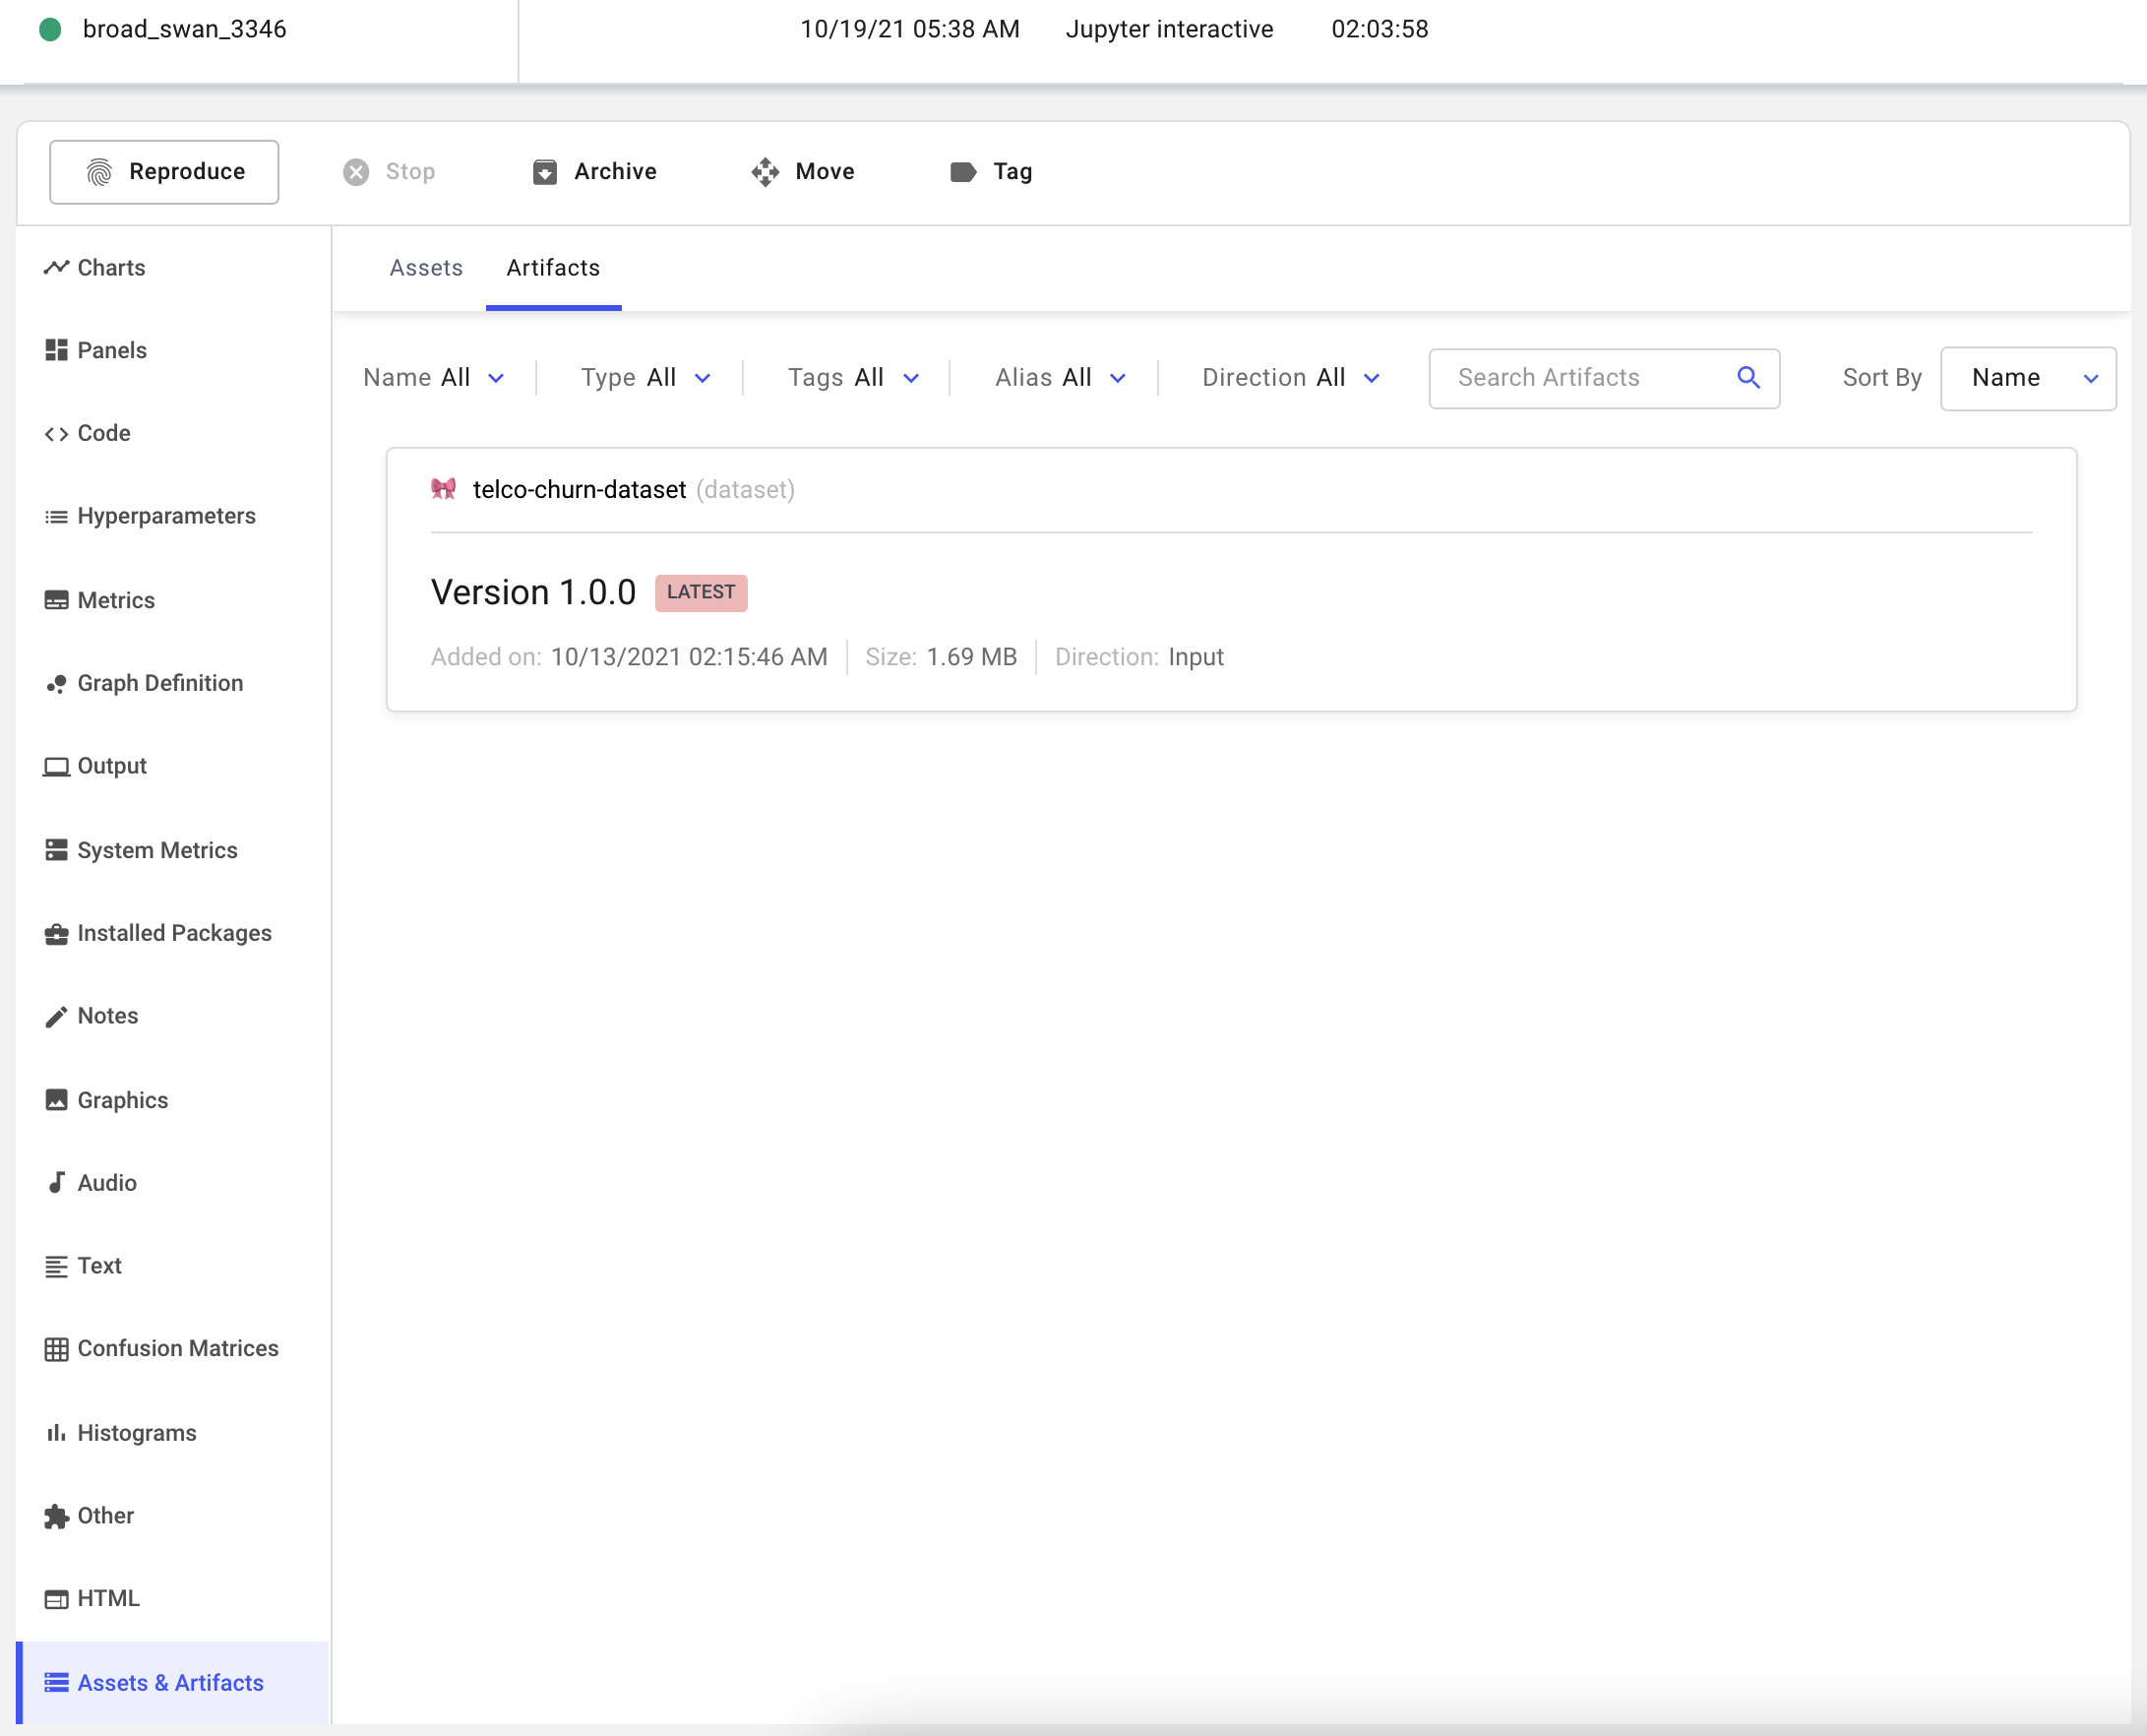
Using Artifacts allows us to track the exact version of input data used in this experiment. Artifacts can be consumed or produced by an experiment, and can be viewed in the Assets and Artifacts tab in the single Experiment view.
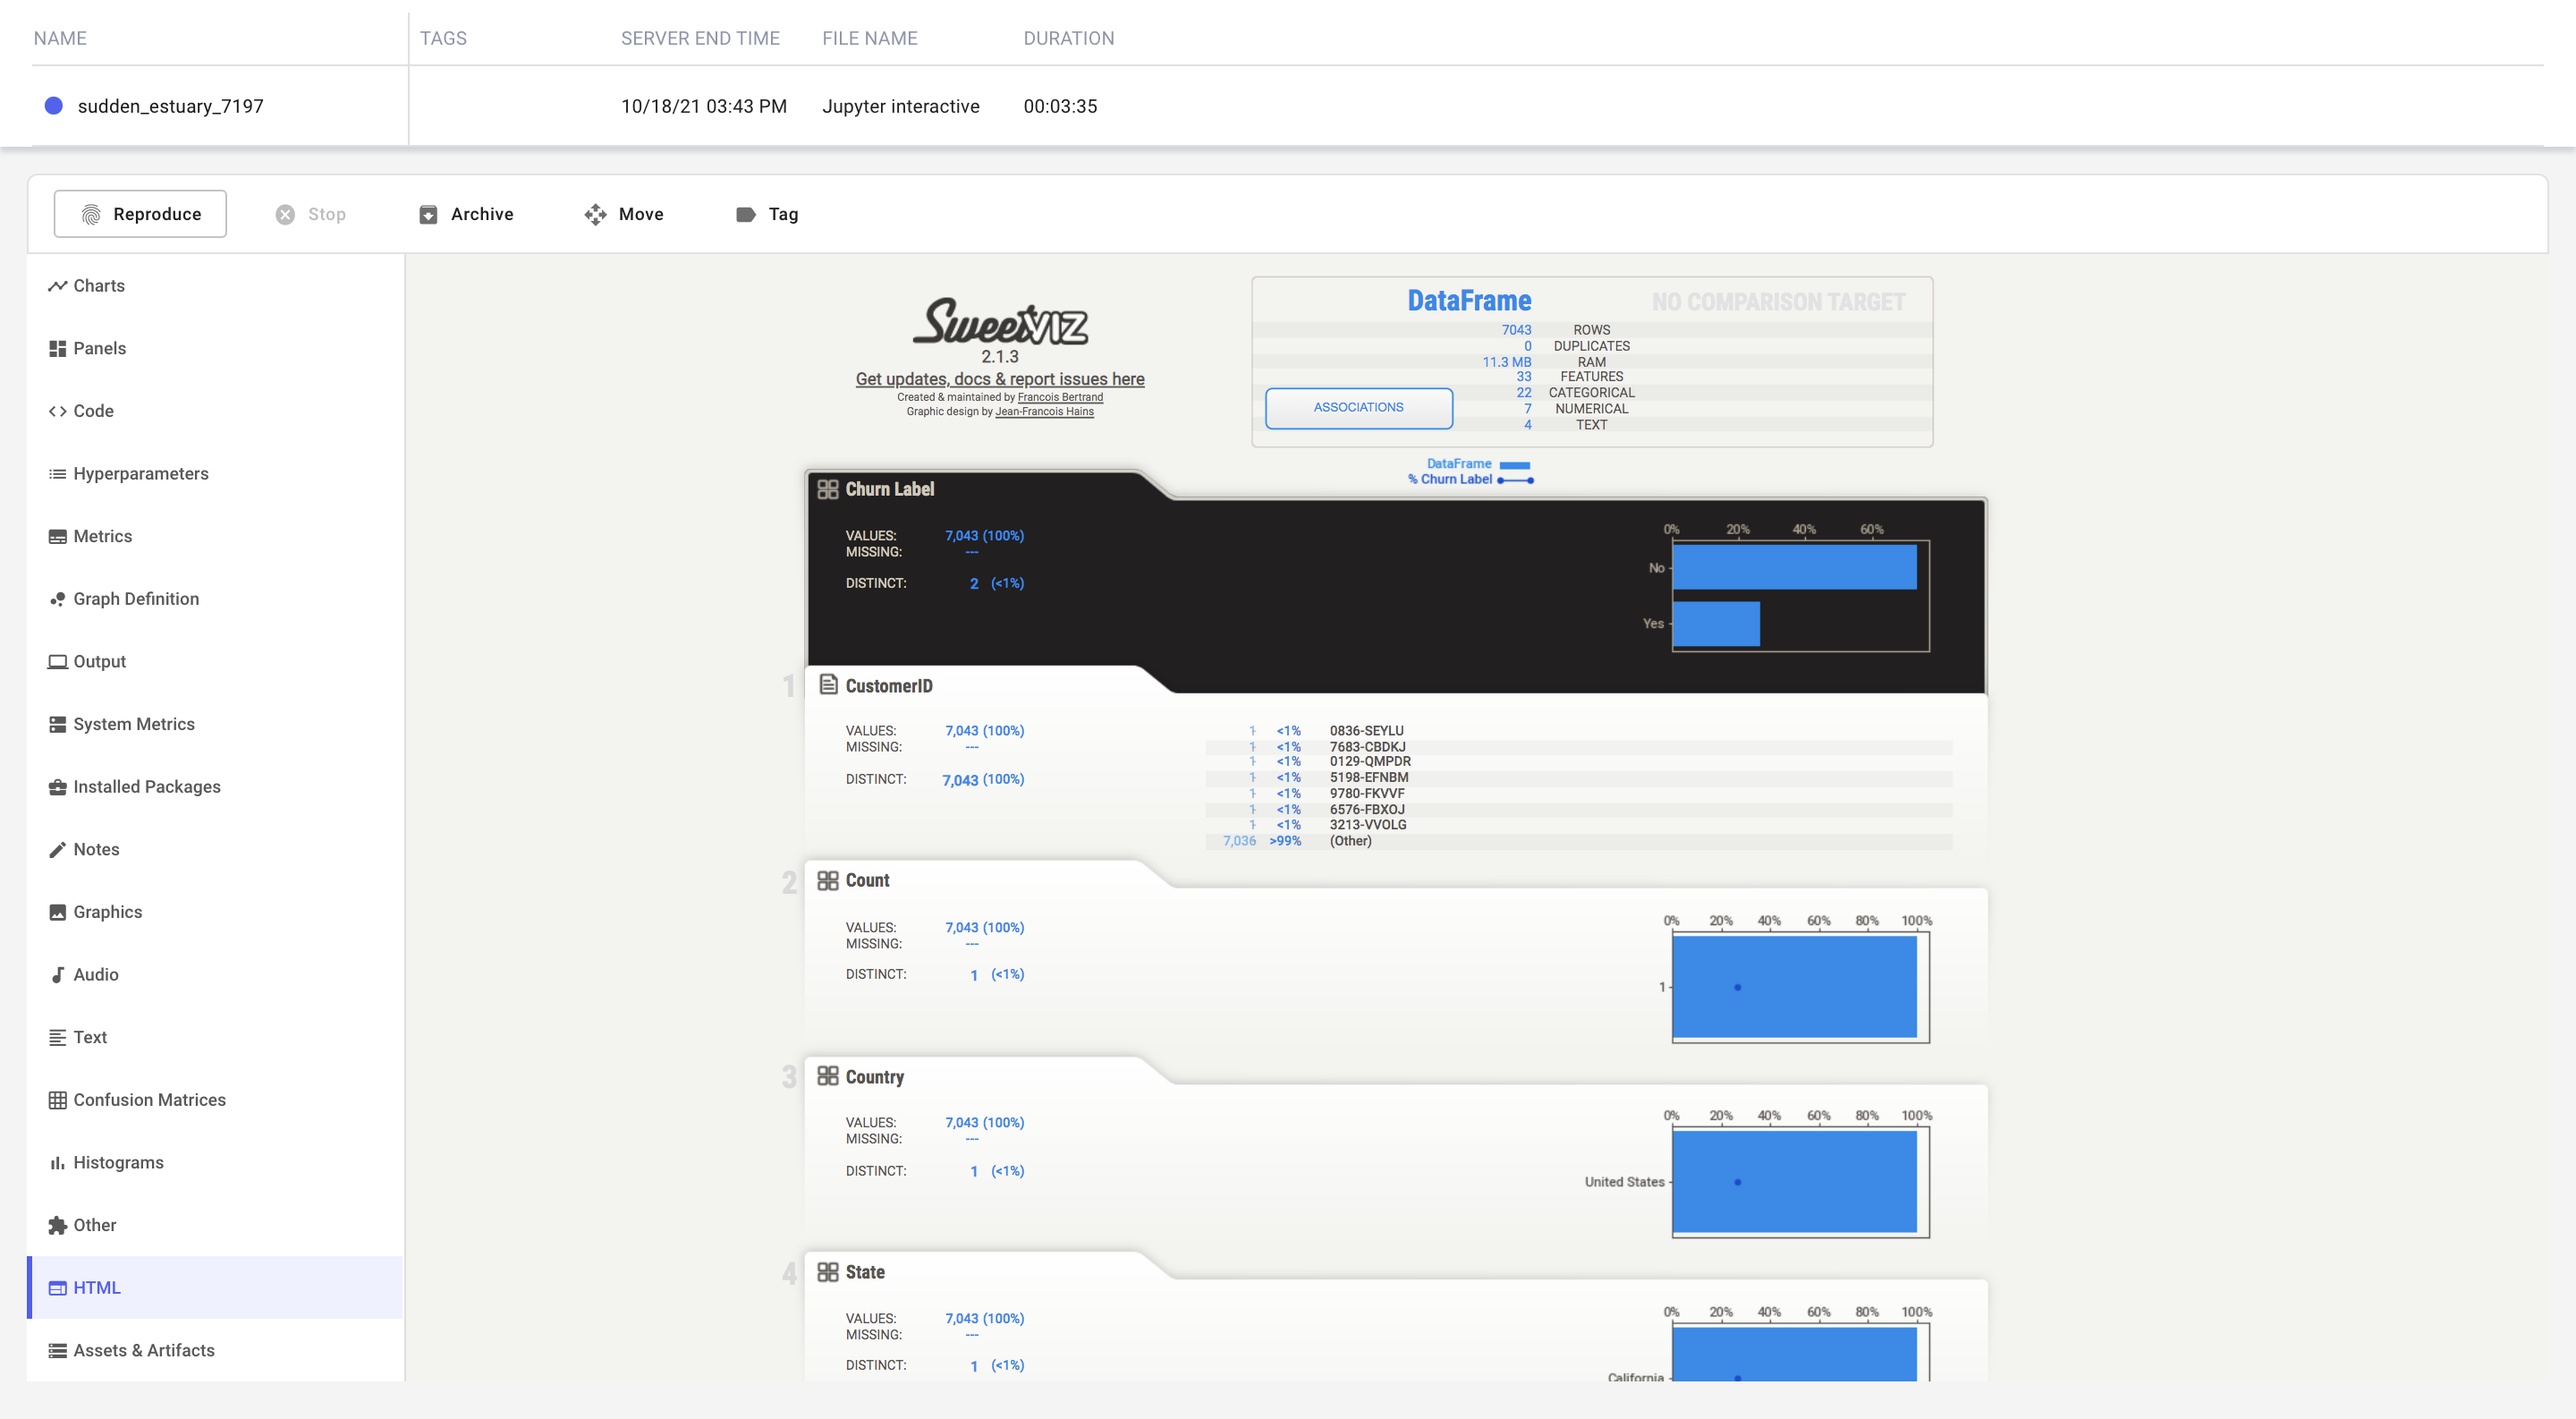
Now that we've fetched our data, we will use Comet's integration with Sweetviz to profile the dataset and log the resulting report to our experiment.
import sweetviz

df = pd.read_csv('./telco-churn-dataset.csv', index_col=0)
report = sweetviz.analyze(df, target_feat='Churn Label')
report.log_comet(experiment)
Train and evaluate a baseline model
We will use scikit-learn's RandomForestClassifier as our baseline model. Since we are using scikit-learn as our framework, Comet automatically logs the model parameters without requiring additional instrumentation code.
Note
Check out our Integrations section for more details about using Comet's automatic logging capabilities with your preferred machine learning framework.
from sklearn.ensemble import RandomForestClassifier

clf = RandomForestClassifier()
clf.fit(X_train, y_train)
The logged parameters can be found under the Hyperparameters tab in the Experiment view. 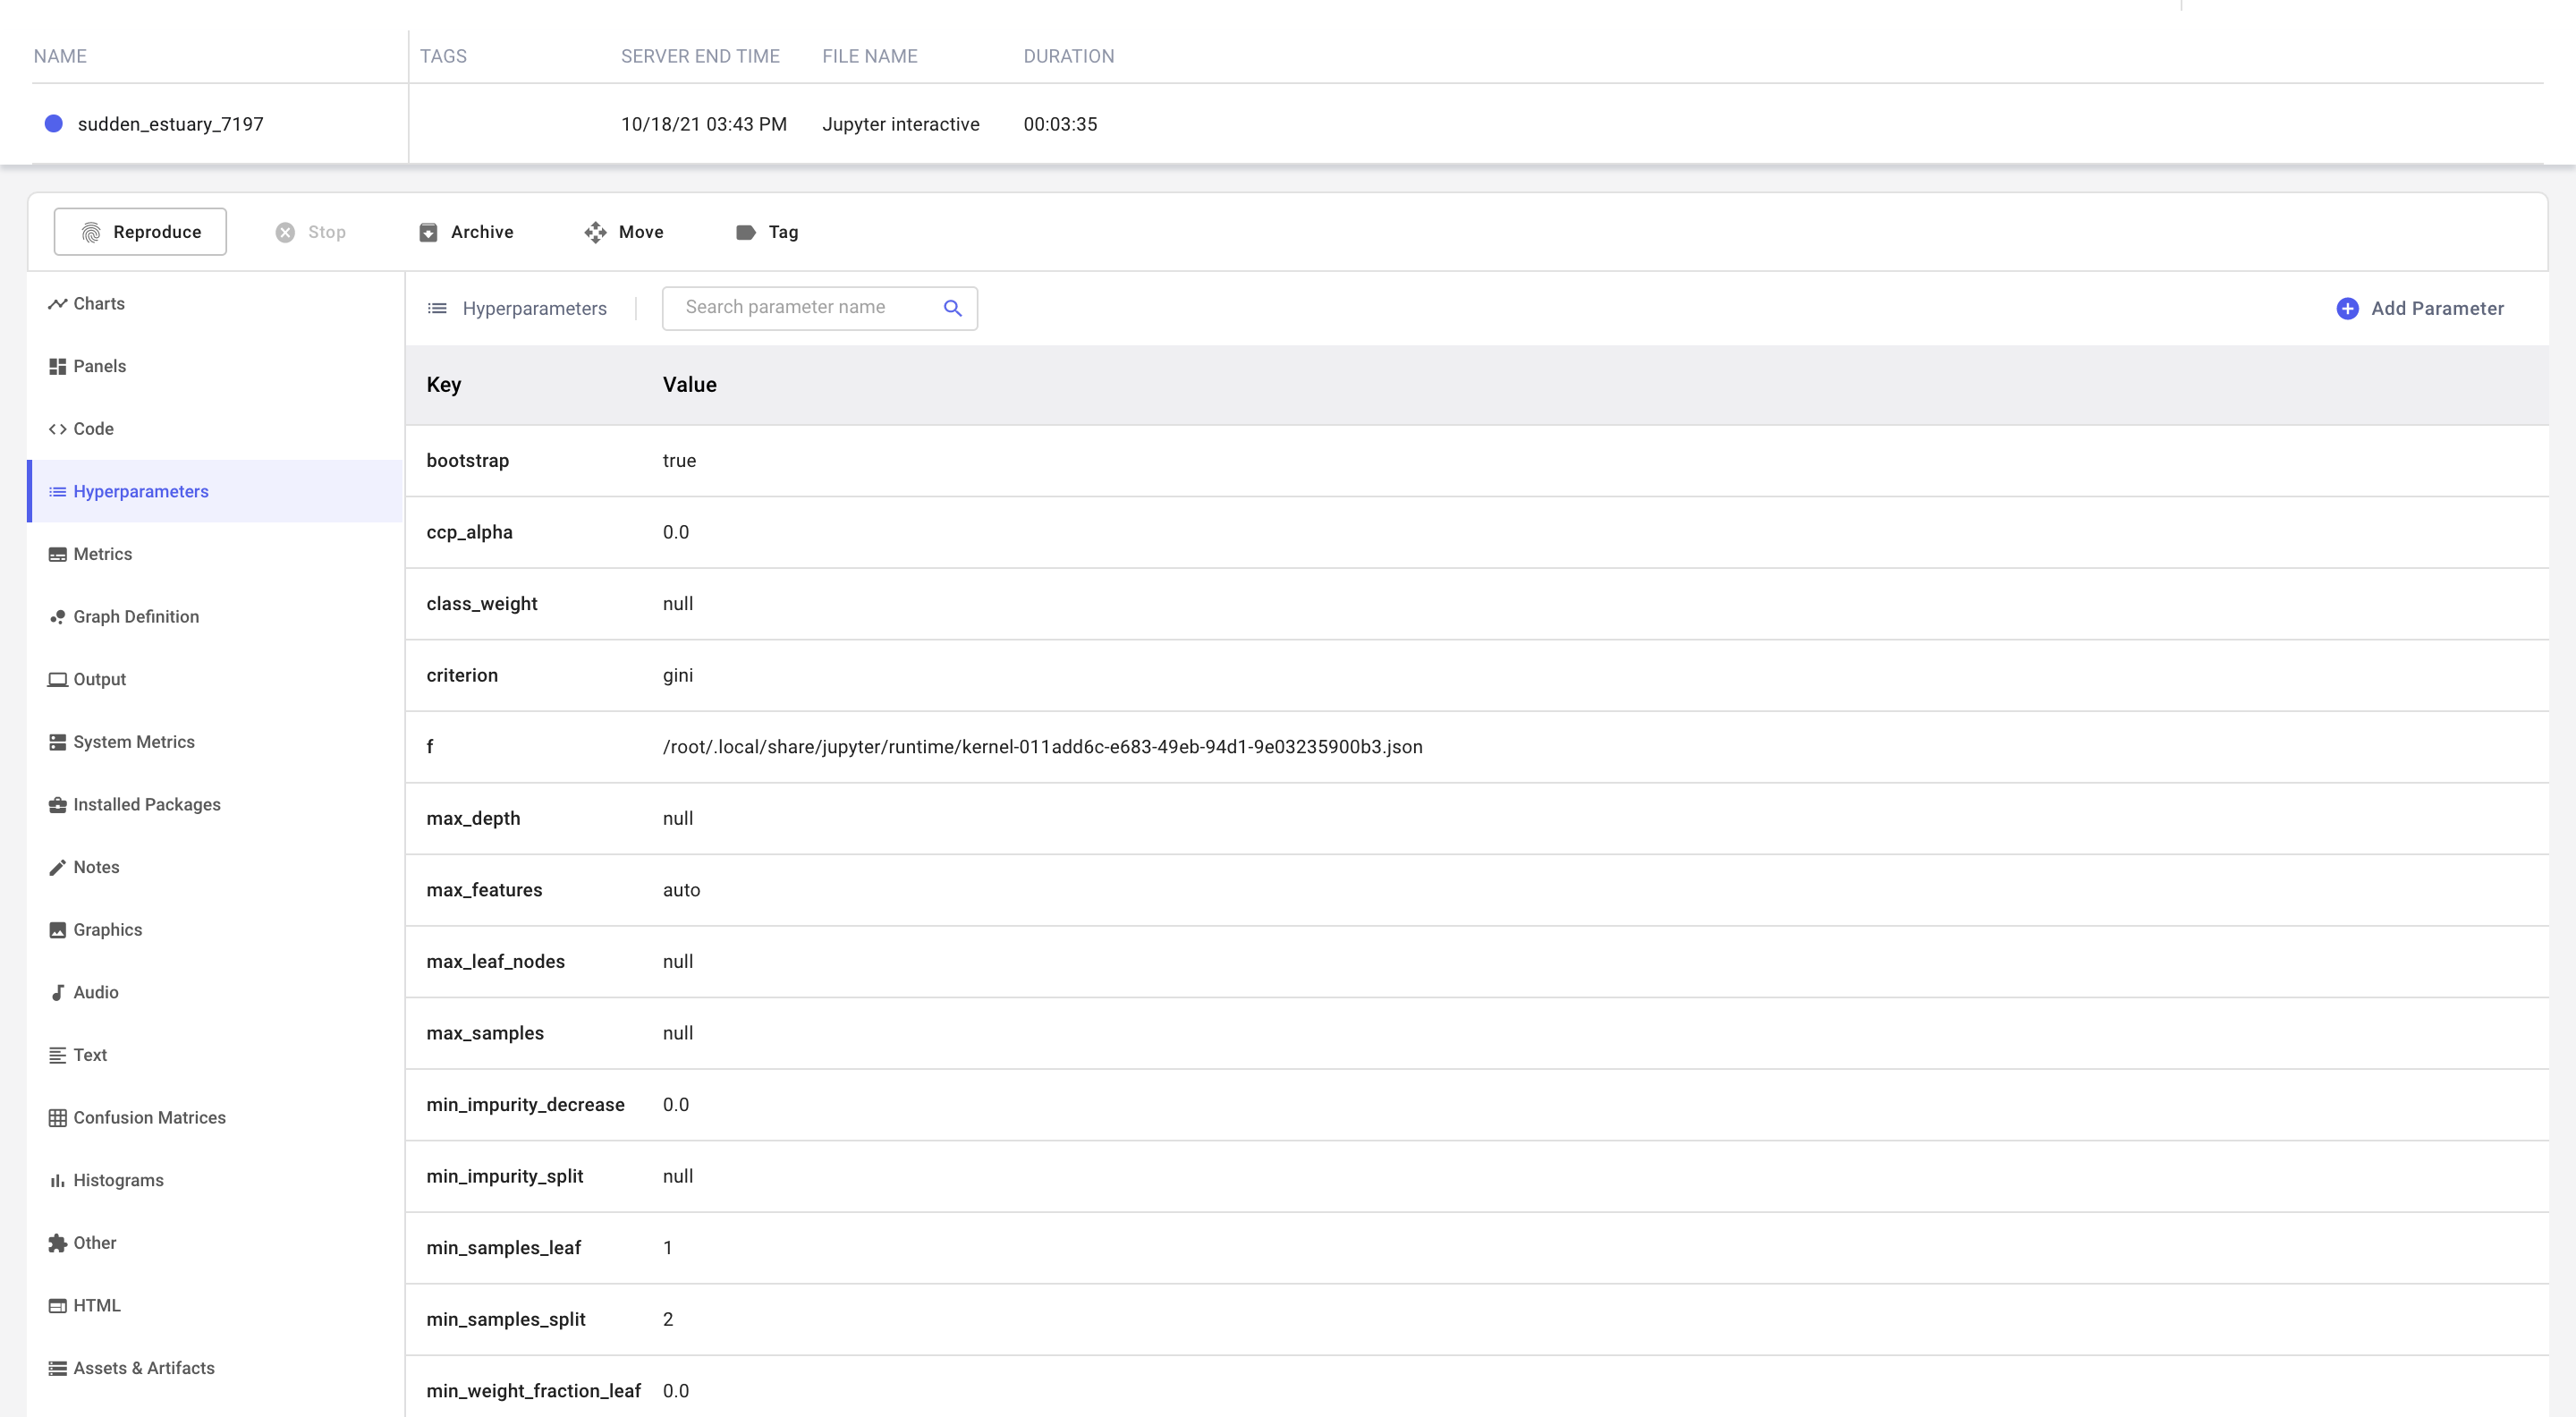
Log metrics from a classification report
Now that we've trained our baseline model, let's compute some metrics to assess model performance. We're going to create a classification report using scikit-learn, and log the resulting metrics, f1, precision, and recall to Comet.
The report is a dictionary with the following structure:
{
    "0": {
        "precision": 0.9997591522157996,
        "recall": 1.0,
        "f1-score": 0.9998795616042394,
        "support": 4151,
    },
    "1": {
        "precision": 1.0,
        "recall": 0.9993215739484396,
        "f1-score": 0.999660671869698,
        "support": 1474,
    },
    "accuracy": 0.9998222222222222,
    "macro avg": {
        "precision": 0.9998795761078998,
        "recall": 0.9996607869742198,
        "f1-score": 0.9997701167369687,
        "support": 5625,
    },
    "weighted avg": {
        "precision": 0.999822265039606,
        "recall": 0.9998222222222222,
        "f1-score": 0.9998222027653569,
        "support": 5625,
    },
}
accuracy, which is a simple key-value pair. We would like to compute these metrics for each dataset split (train, test) and log the values in this dictionary in a way that preserves all the information provided by the keys.
We can use the prefix option in the experiment.log_metrics method to appropriately add the dictionary keys to our model metric names. Also, to keep the evaluation code concise, we will use Comet's Experiment Context to append the appropriate context to our model metric names.
from sklearn.metrics import classification_report


def log_classification_report(y_true, y_pred):
    report = classification_report(y_true, y_pred, output_dict=True)
    for key, value in report.items():
        if key == "accuracy":
            experiment.log_metric(key, value)
        else:
            experiment.log_metrics(value, prefix=f"{key}")


with experiment.train():
    log_classification_report(y_train, clf.predict(X_train))

with experiment.test():
    log_classification_report(y_test, clf.predict(X_test))
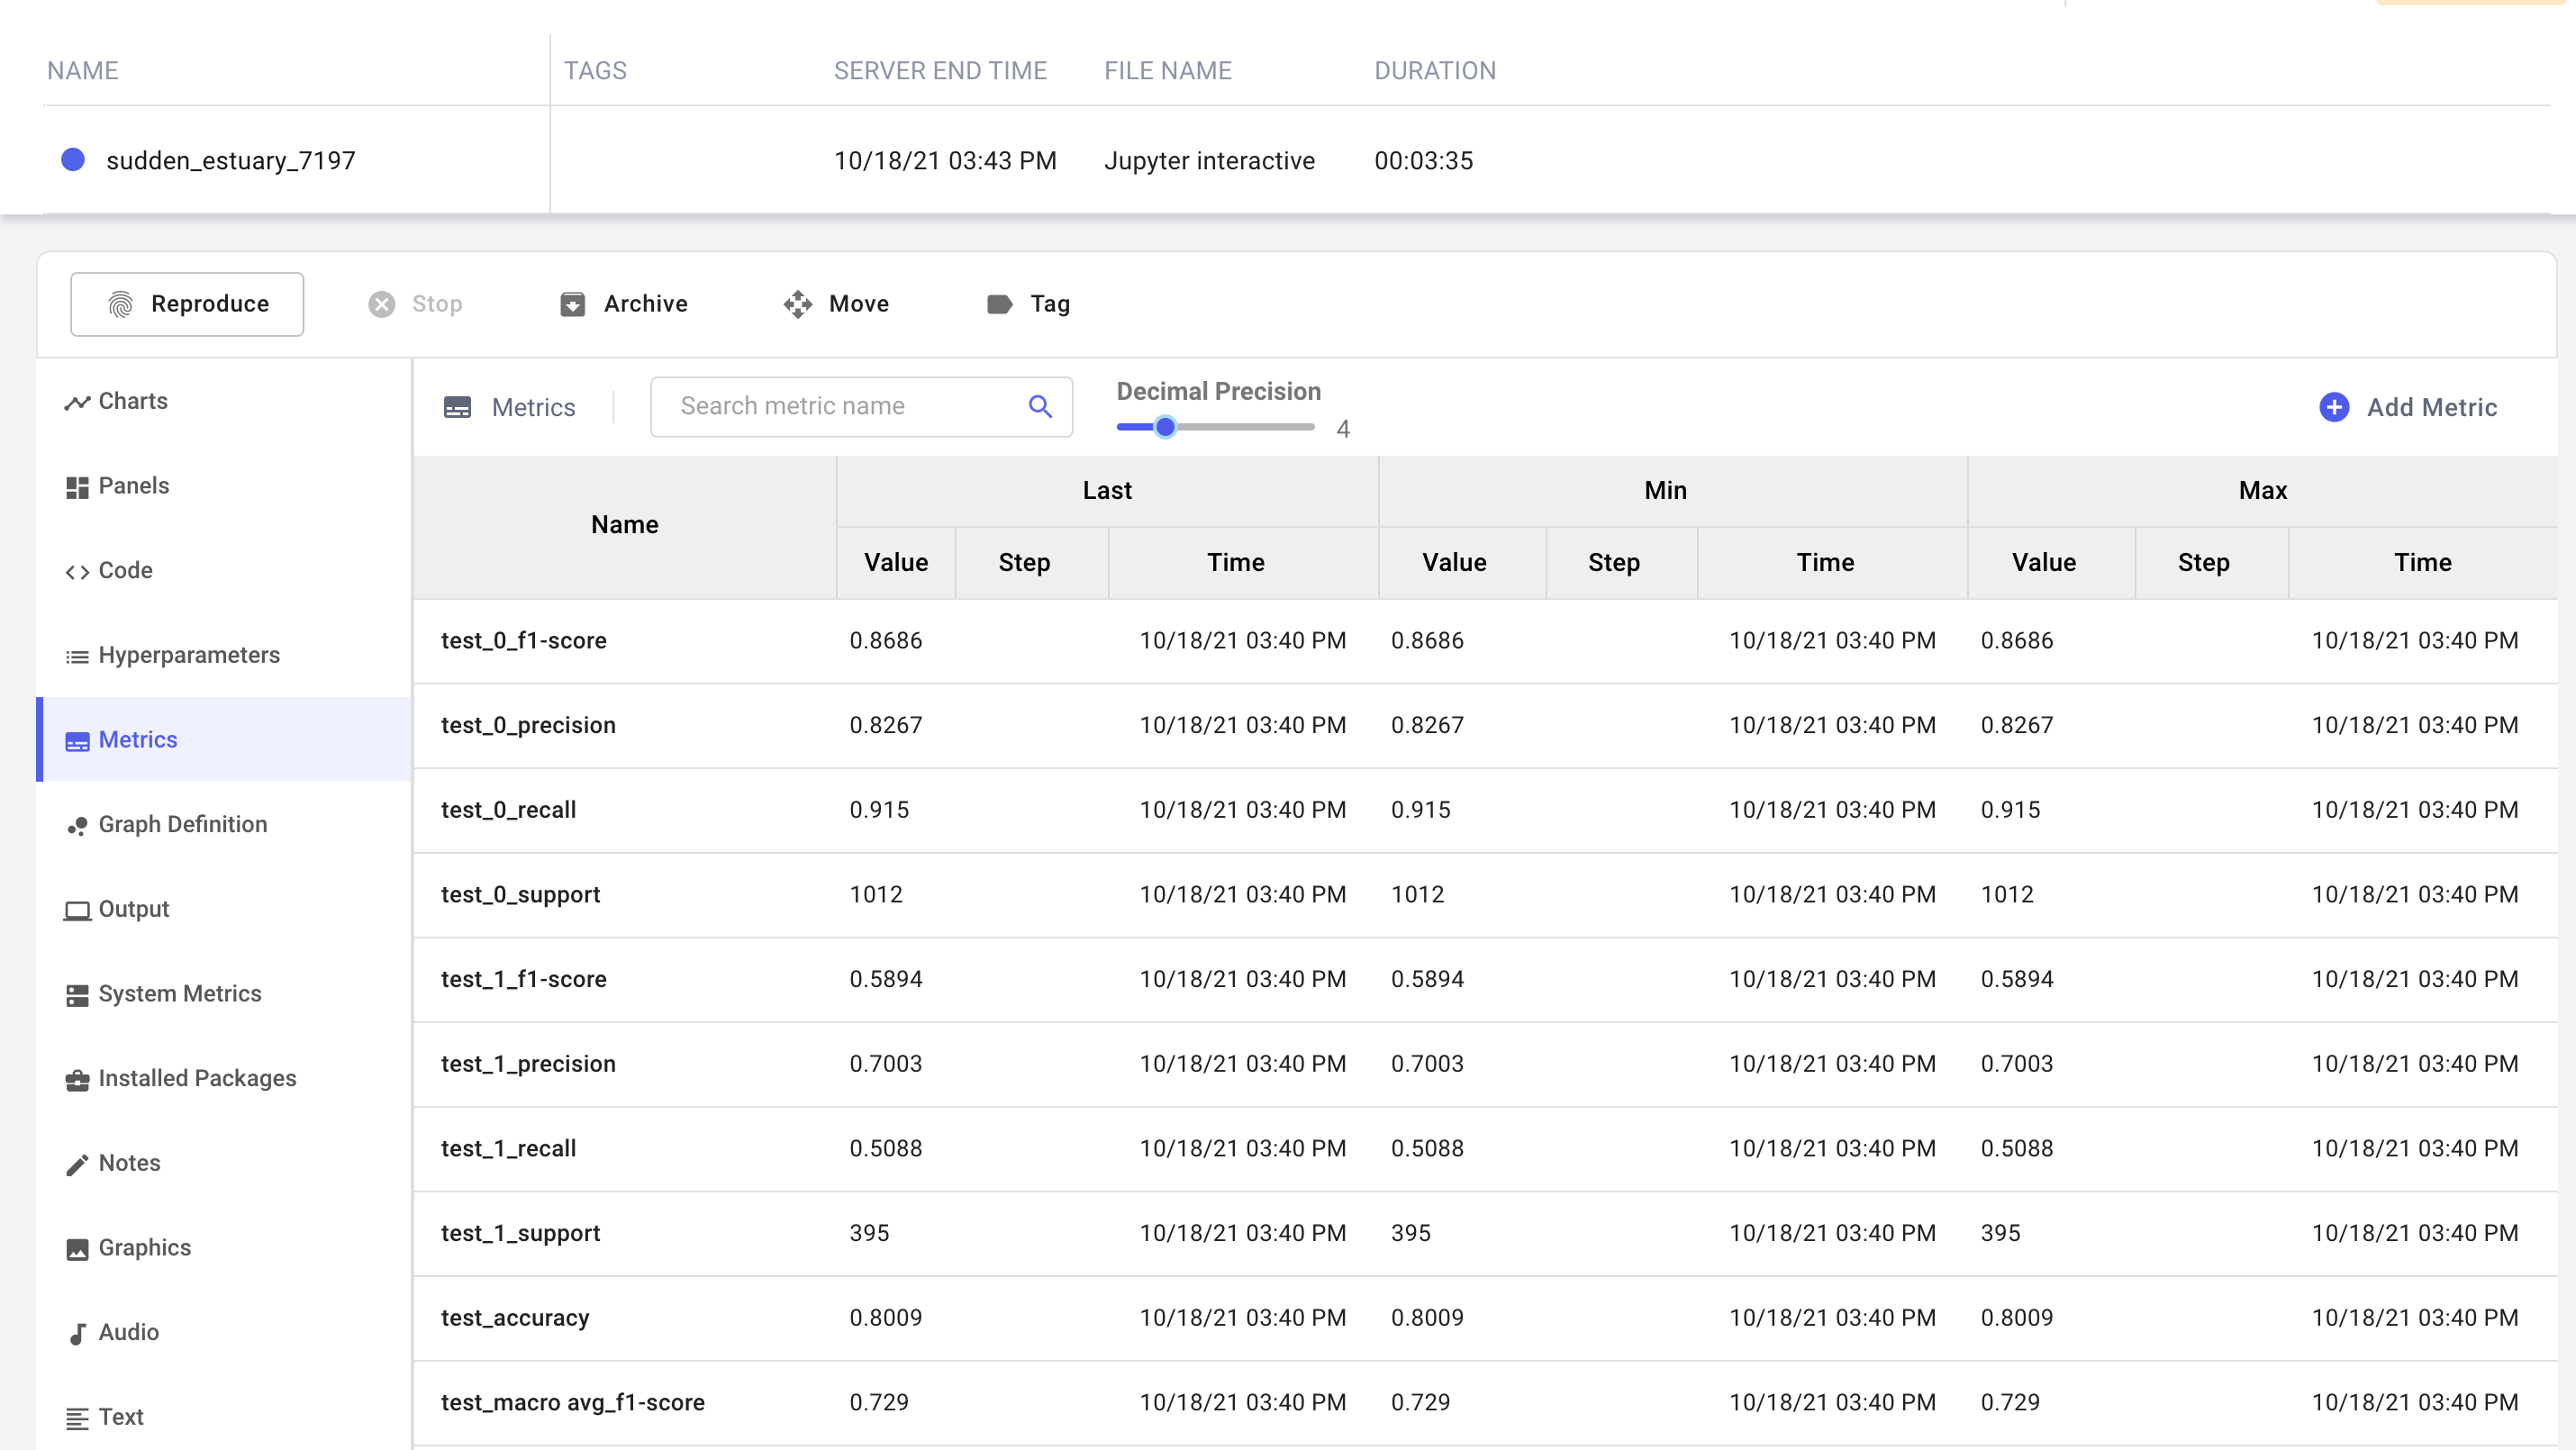
Notice how we have preserved all the contextual information around the metric.
Log a confusion matrix
Now that we have logged a few metrics, let's see where our classifier is having difficulties, by logging a Confusion Matrix and inspecting the misclassified examples.
Comet's Confusion Matrix lets you log samples of data along with the model predictions, so that you can identify the specific features your model is having trouble with. Since we have a large number of features in our data, we will only log a subset of them for this example.
def index_to_example(index):
    return X_test.iloc[index, :][["CLTV", "Monthly Charges", "Total Charges"]].to_json()


experiment.log_confusion_matrix(
    y_test.tolist(),
    clf.predict(X_test).tolist(),
    index_to_example_function=index_to_example,
)
The logged matrix can be found under the Confusion Matrix tab in the Experiment view: 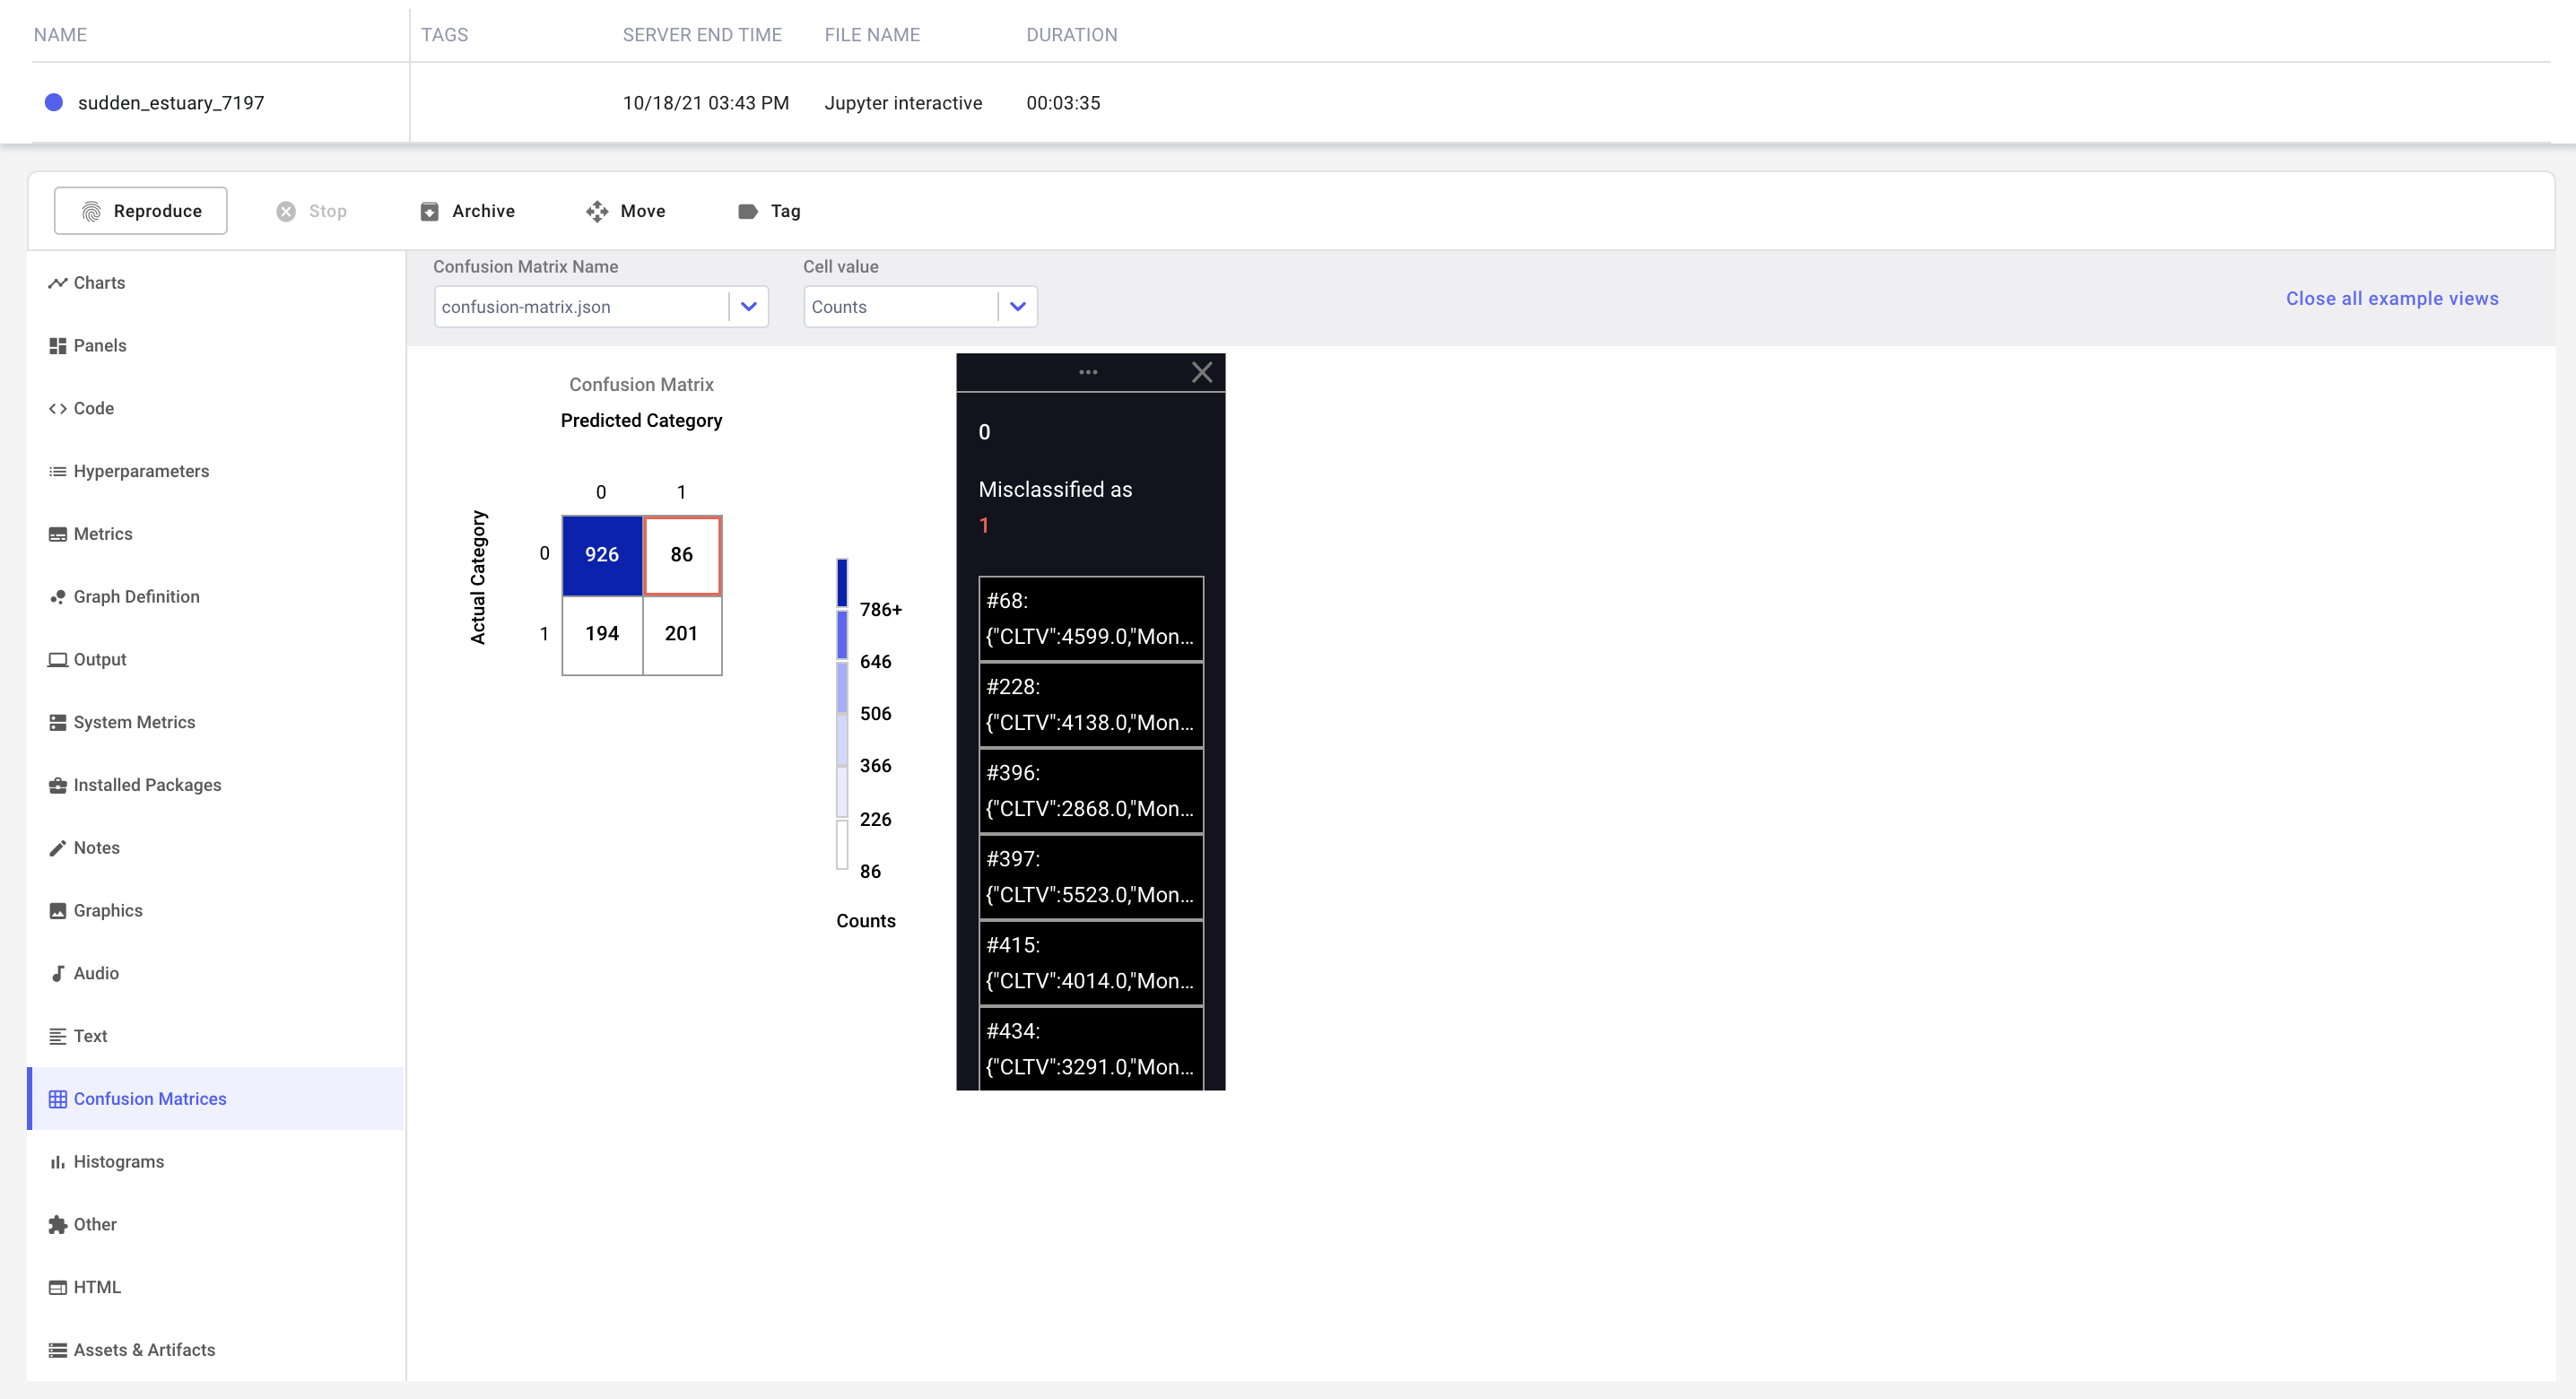
Try it out!
We have prepared a Colab Notebook that you can use to run the example yourself.
![]()
More examples
Other typical end-to-end examples showcase how Comet is used to handle the challenges presented by natural language processing (NLP) and image data.