Monitor models in the MPM UI
This page describes how to use the MPM UI to monitor the performance of registered models.
There is no special setup to perform. Simply start sending Comet your model's input features and predictions.
Main MPM page
In this page, you can see the performance of all the models in production - at a glance. You can see which are running well and which are anomalous in any way. It shows model health (that is, the extent of data drift), model stability (that is, is the number of predictions that are being output from the models stable, or non-zero), as well as alerts.
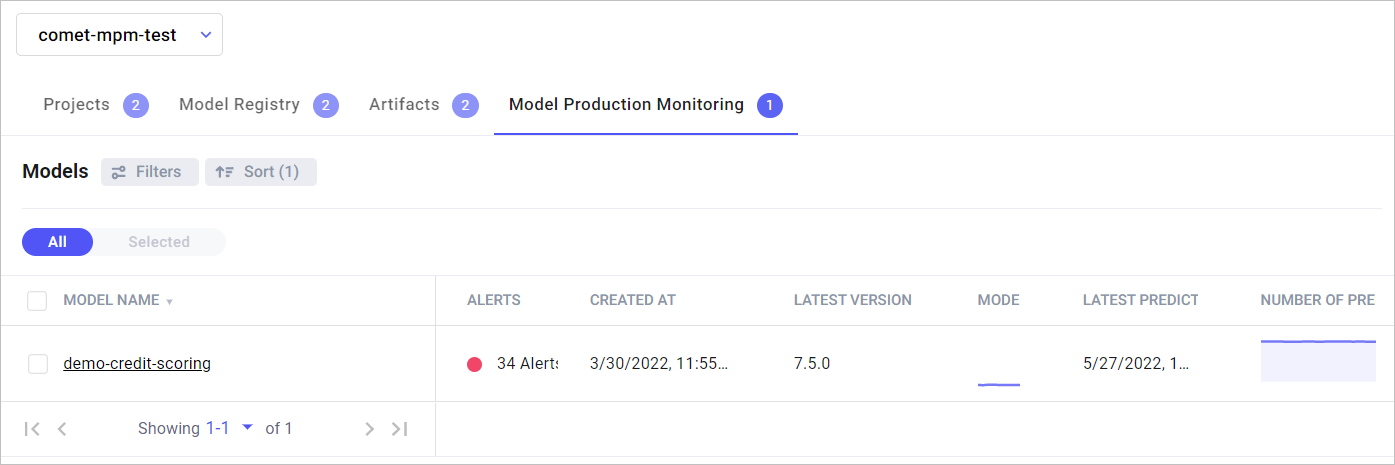
Filter, sort, and search the models
- Filter: You can filter the models based on the columns in the table. In the panel view, you can filter based on the data in the table.
- Sort: You can sort, based on the columns in the table. You can also sort explicitly using search criteria.
Model dashboard
Click on a model to display a dedicated dashboard. The dashboard provides three tabs:
- Model performance
- Features
- Alerts
View graphs
You can view data for a specific version of the model or for all versions. You can zoom in or out of data by changing the period under view:
- Daily or hourly
- For seven days, 30 days, or 90 days
- For a specific period (by clicking the calendar icon)

Model performance tab
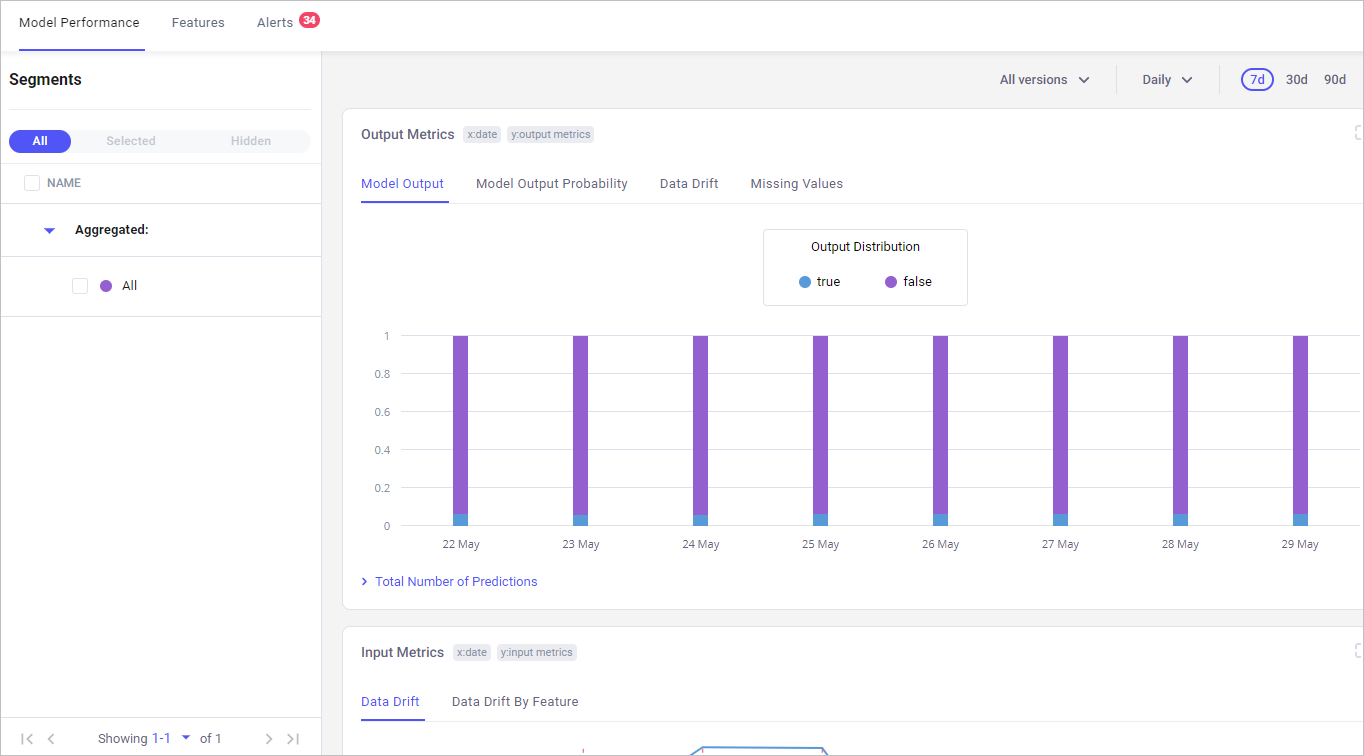
This tab is probably the most important for tracking models in production.
Model performance monitors significant changes in the model’s output. The main metrics tracked in the tab are output distribution, output data drift, input data drift and input data drift by feature. By tracking these, you can more accurately identify underlying issues.
Model performance is visualized in the following panels: output metrics, input metrics, system metrics.
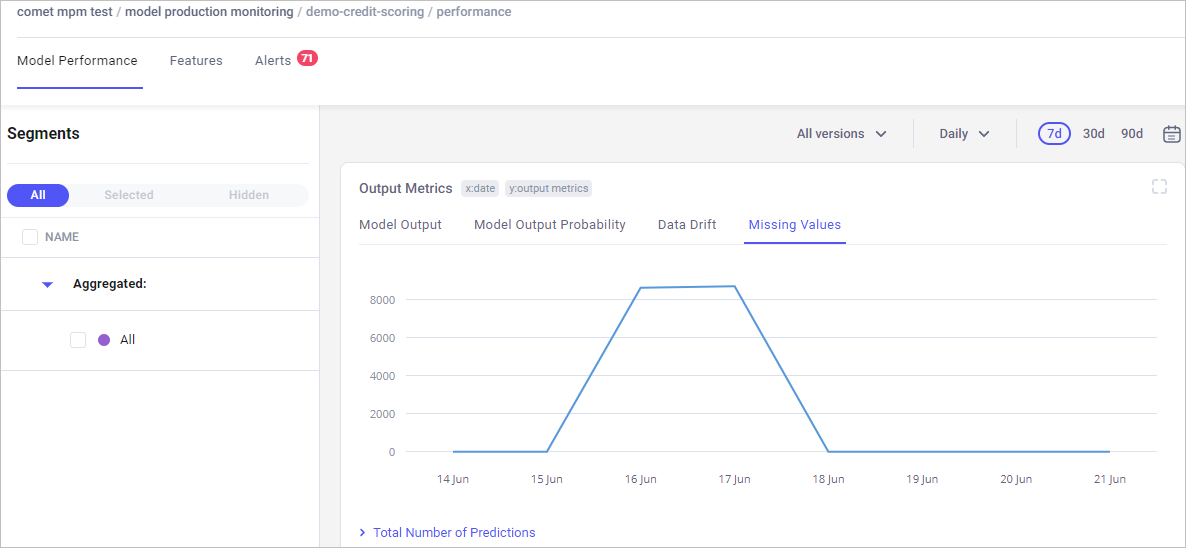
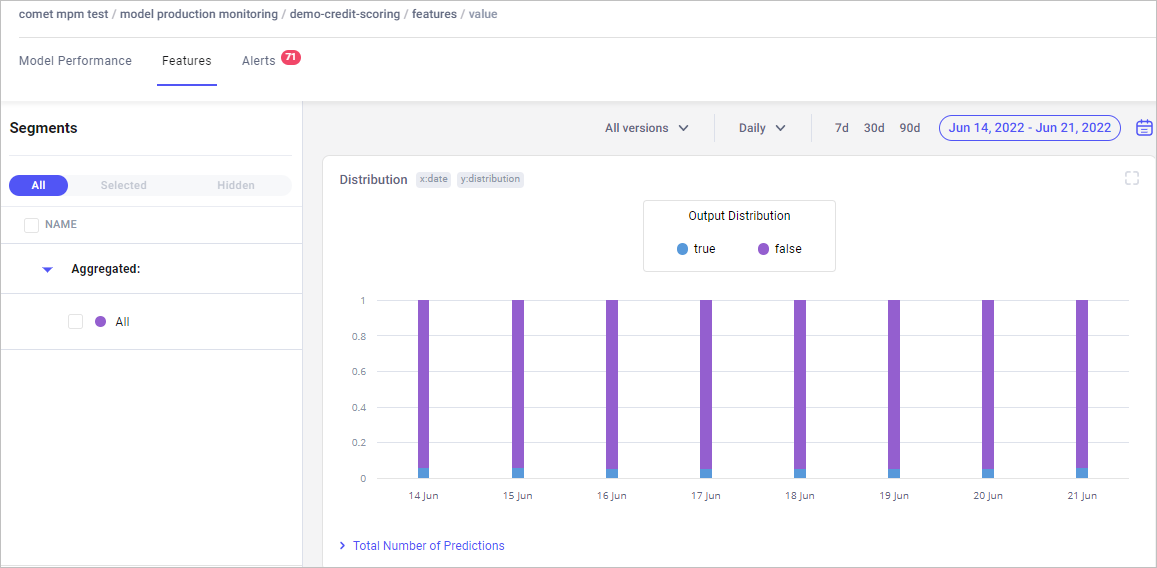
Output metrics
- Model output: Plots what the model actually predicted - in the model output shown above, the prediction was
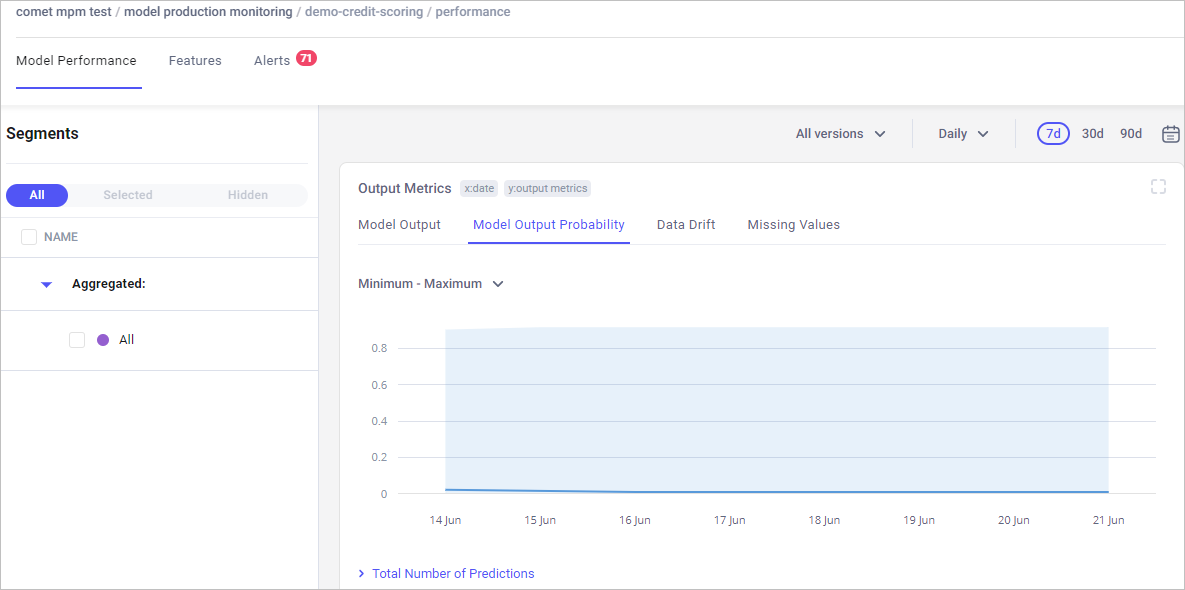
trueorfalse. If, for example, you saw onlytrueorfalse, that would indicate a problem worth investigating. Model output probability: Shows the distribution of probability of the prediction that the model made.
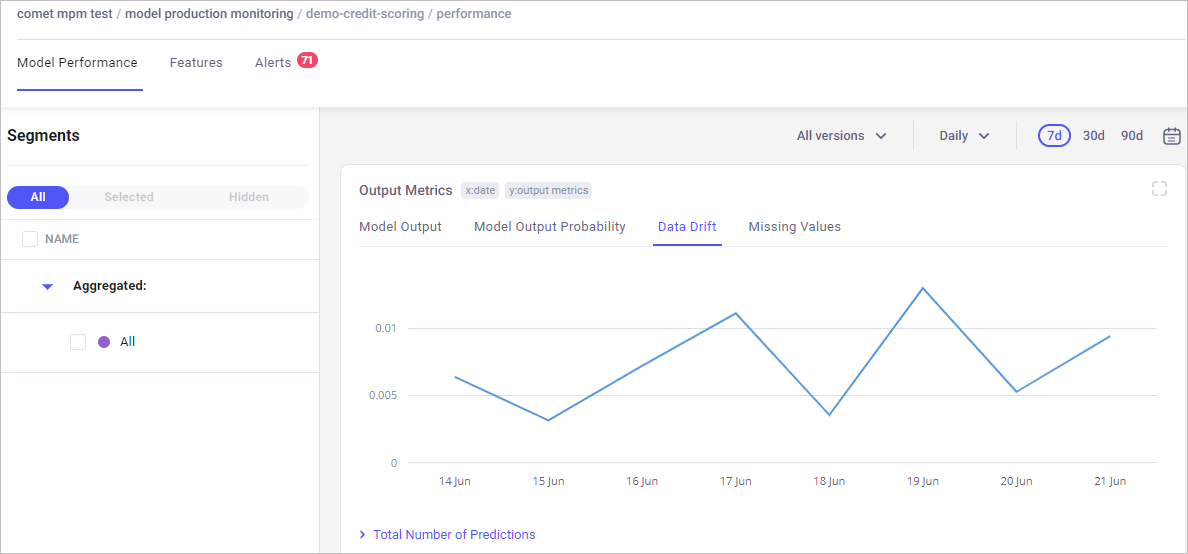
Data drift: Visualizes the change in model output data that can lead to model performance degradation.
Missing values: Shows where the model is not receiving data. The objective is to compare if the level of missing data stays within an "acceptable" range, both for the whole dataset and individual features.
Input metrics
Data drift: Shows the change in model input data that can lead to model performance degradation.
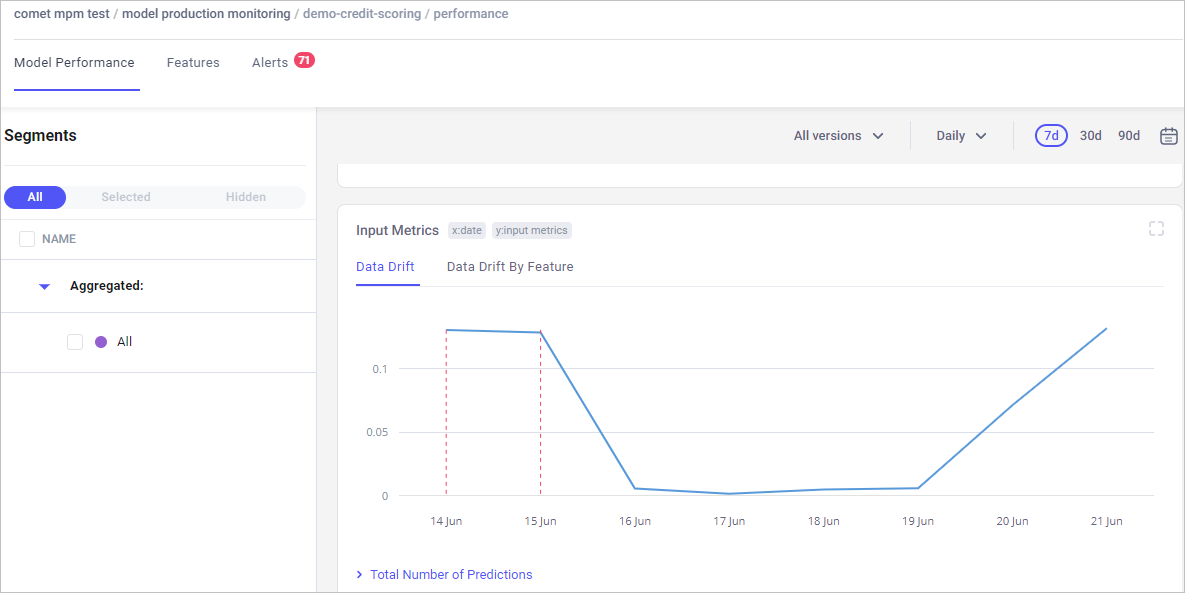
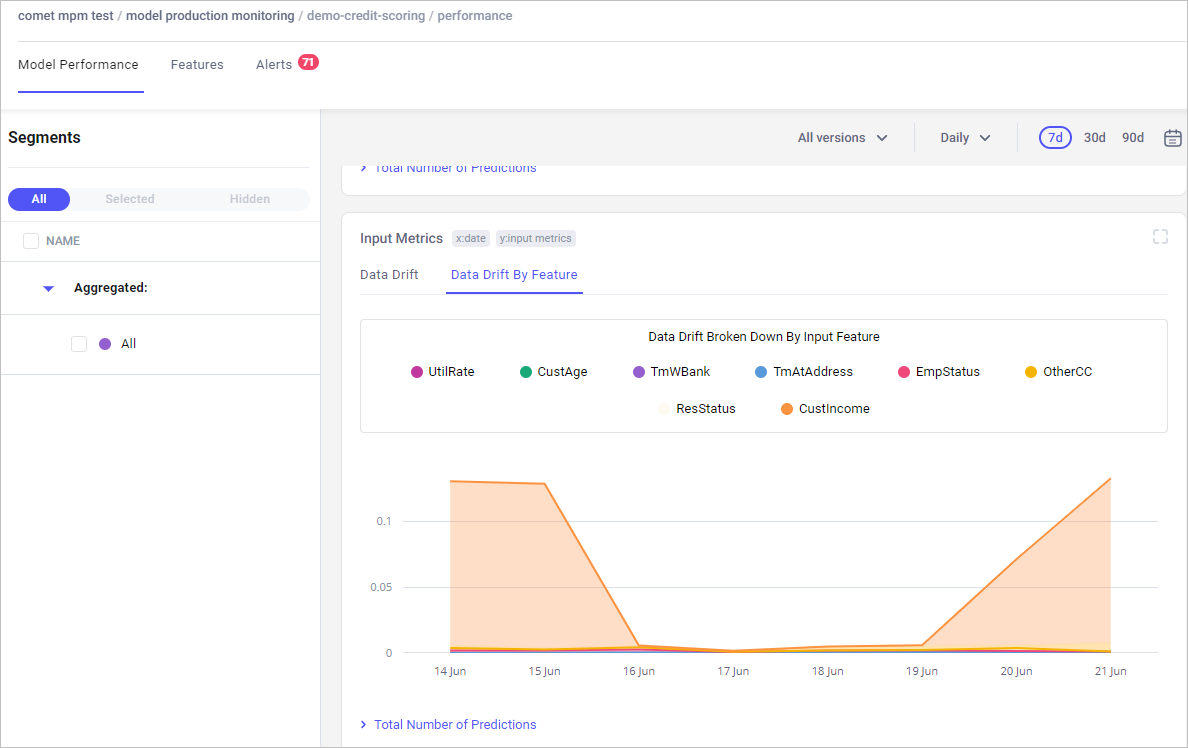
Data drift by feature: Visualizes how each feature contributes to the model-level data drift over time. It is essentially the average of the feature drifts. A change often signals that the feature has changed in a way that can impact the accuracy of the model's predictions. This visualization is useful when there is a spike in data drift, for example, when you have hundreds of input features, you can more quickly identify the root cause of the drift.
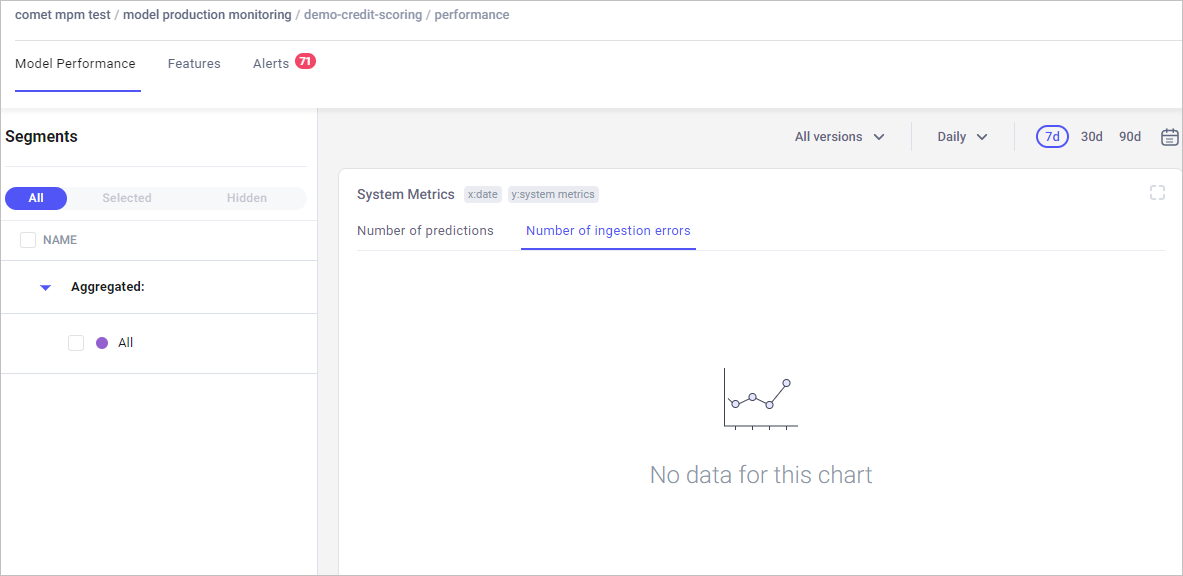
System metrics
System metrics are generic metrics associated with the MPM system. The metrics help you understand - from a high level - the health of the MPM system, by reflecting how much data has been received by MPM and if that data has been processed correctly.
Number of predictions: Total number of data points ingested correctly by MPM.
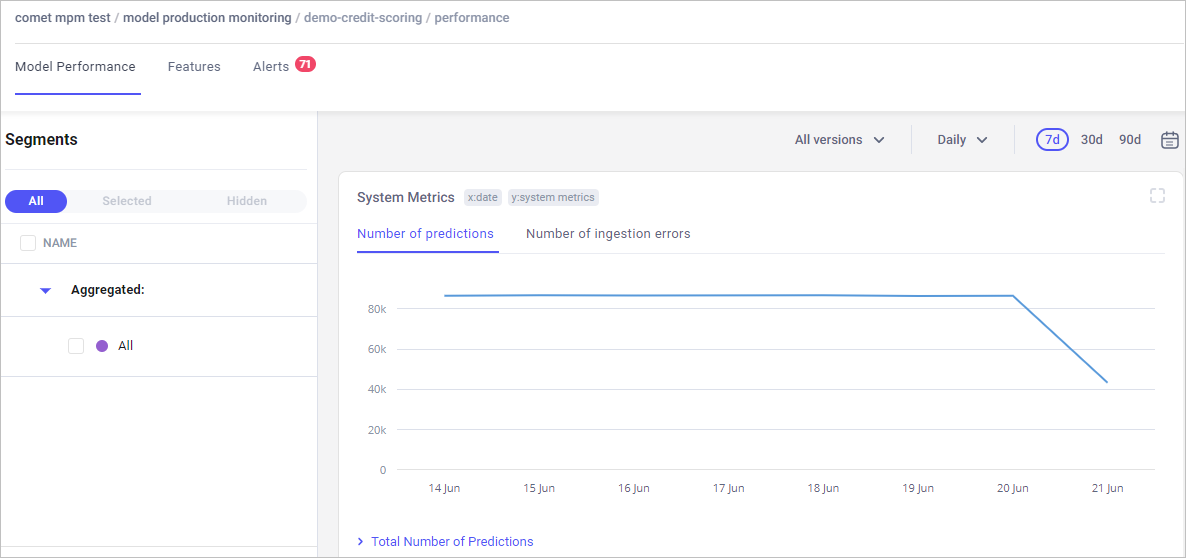
Number of ingestion errors: Total number of data points sent to MPM that could not be processed due to data issues.
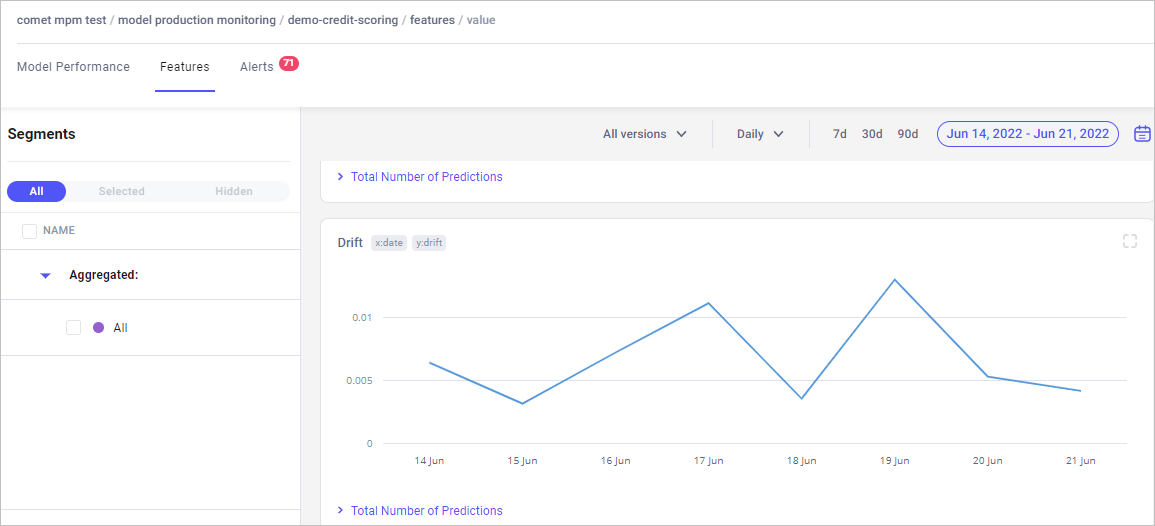
Features tab
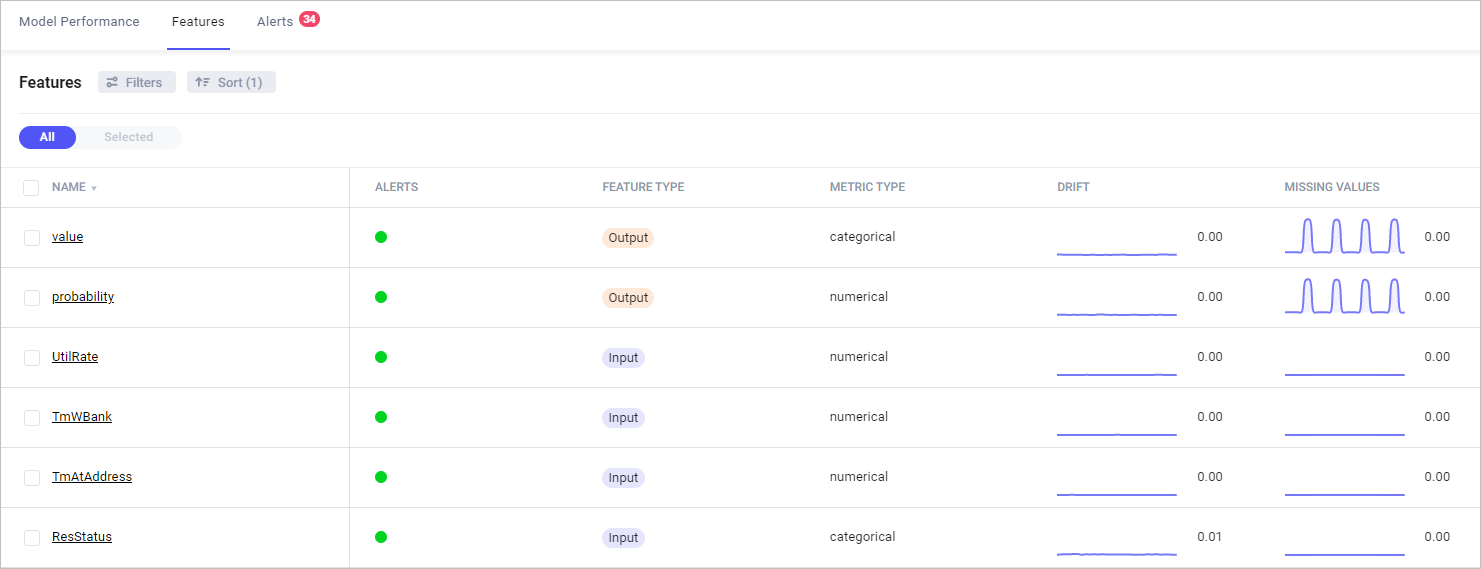
Data under the Features tab visualizes drift and missing values found in the inputs and outputs of features across the models in production.
The main Features page lists features on the left and Feature data is arranged on the right, in the following columns:
- Alerts
- Feature type
- Metric type
- Drift
- Missing values
Click a feature to see visualizations of distribution, drift, and missing values for it.
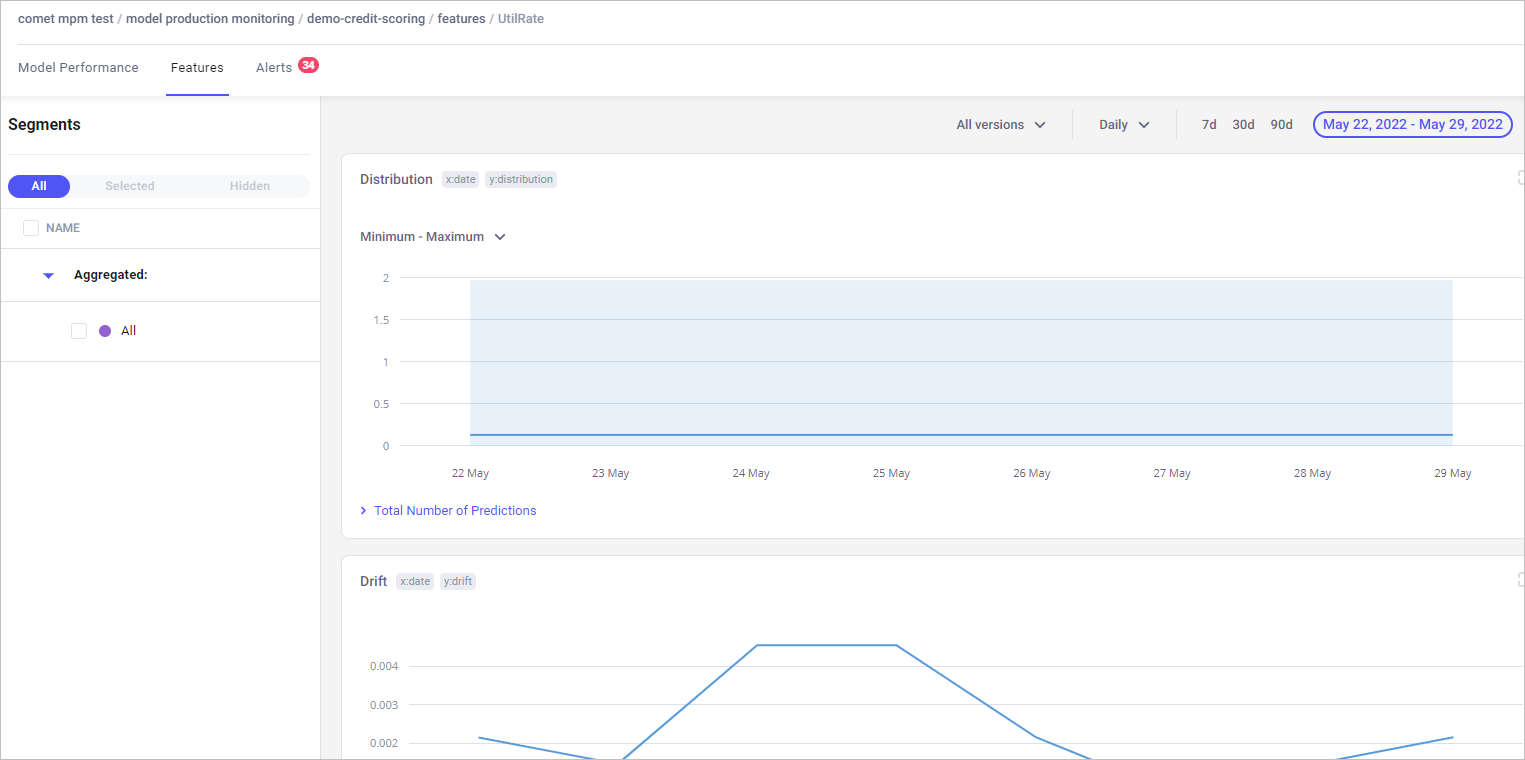
Distribution
Monitors distribution for the feature over time.
Drift
Monitors whether the distribution of the feature in production matches the reference one.
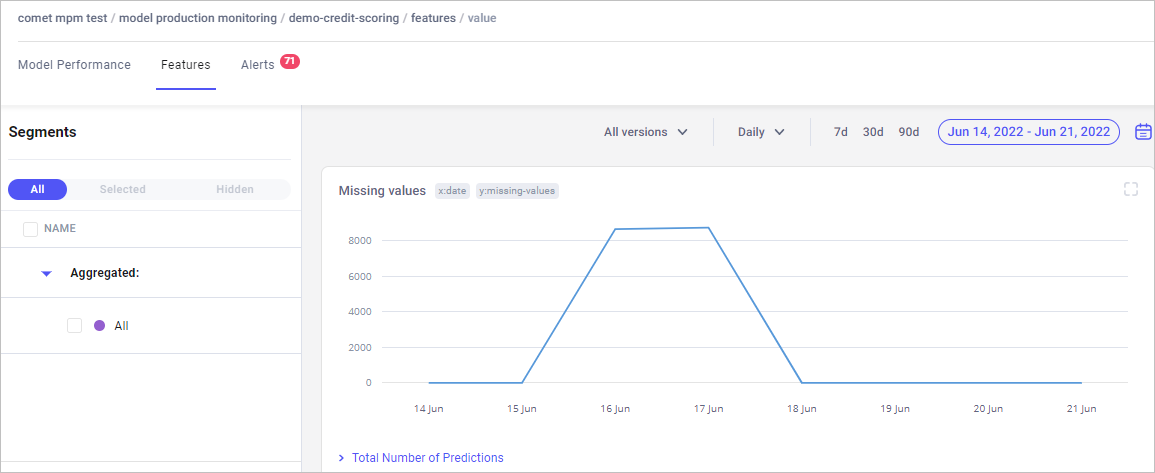
Missing values
Shows where the model is not receiving data for certain features.
Identifying missing values is useful:
- For features that should never be missing, this monitors if the features were missing sometimes.
- For features that could be missing, this monitors that the percentage of predictions without this field is consistent with what is expected.
Alerts tab
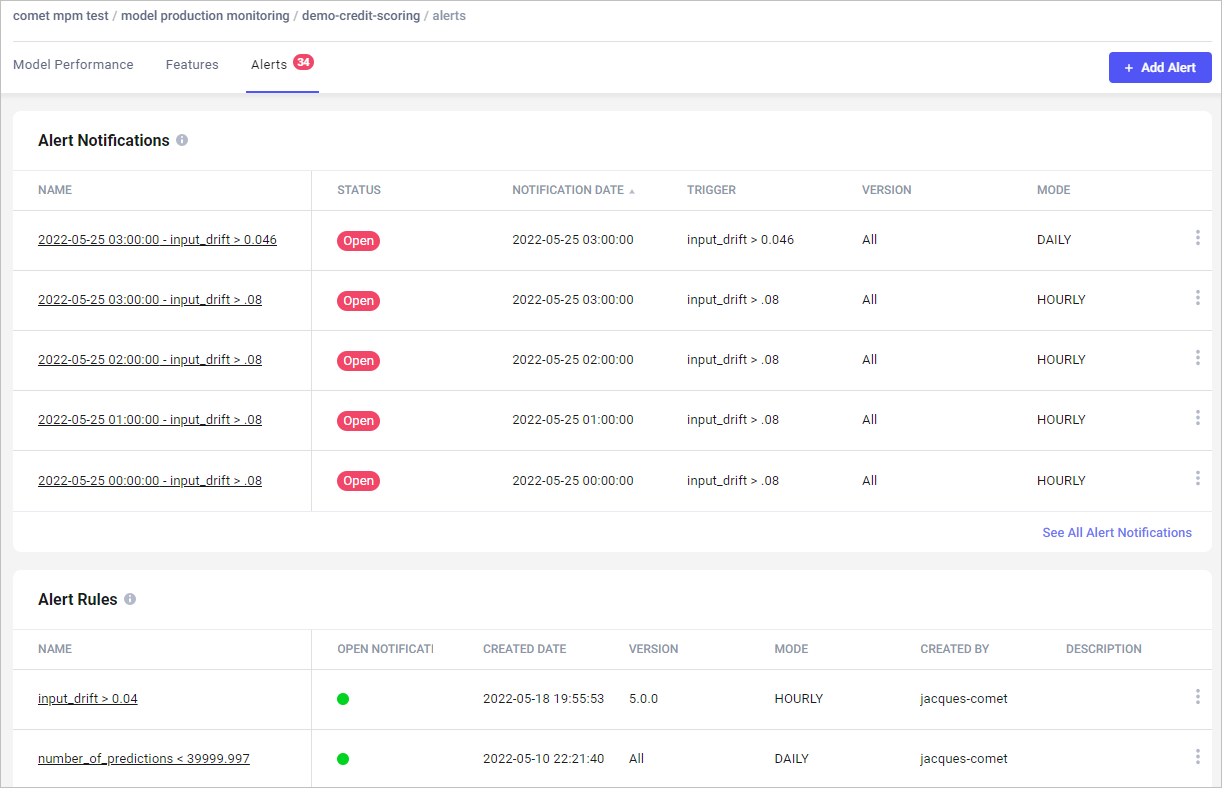
Customizable alerts allow you to create alert rules on any of the metrics you need to follow. A variety of levers let you be informed of exactly what your team cares about.
For example, you might want to monitor the model performance through the input data drift metric. This will track if the distribution of input data undergoes any change.
In the Alerts page, you can:
- View all alert rules that have been set.
- Dismiss an alert notification.
- Add an alert rule (see below for details).
Alerts are integrated with email so you can receive notifications when something is wrong, even when you are not in the Comet UI.
Add alert rules
The rich Alert UI lets you customize alert rules to exactly what you need.
For example, you can track your model based on any metric available in the MPM UI, or based only on a specific model version versus over all versions, daily tracking versus hourly tracking, and much more. In addition, there are several alert types, based on thresholds:
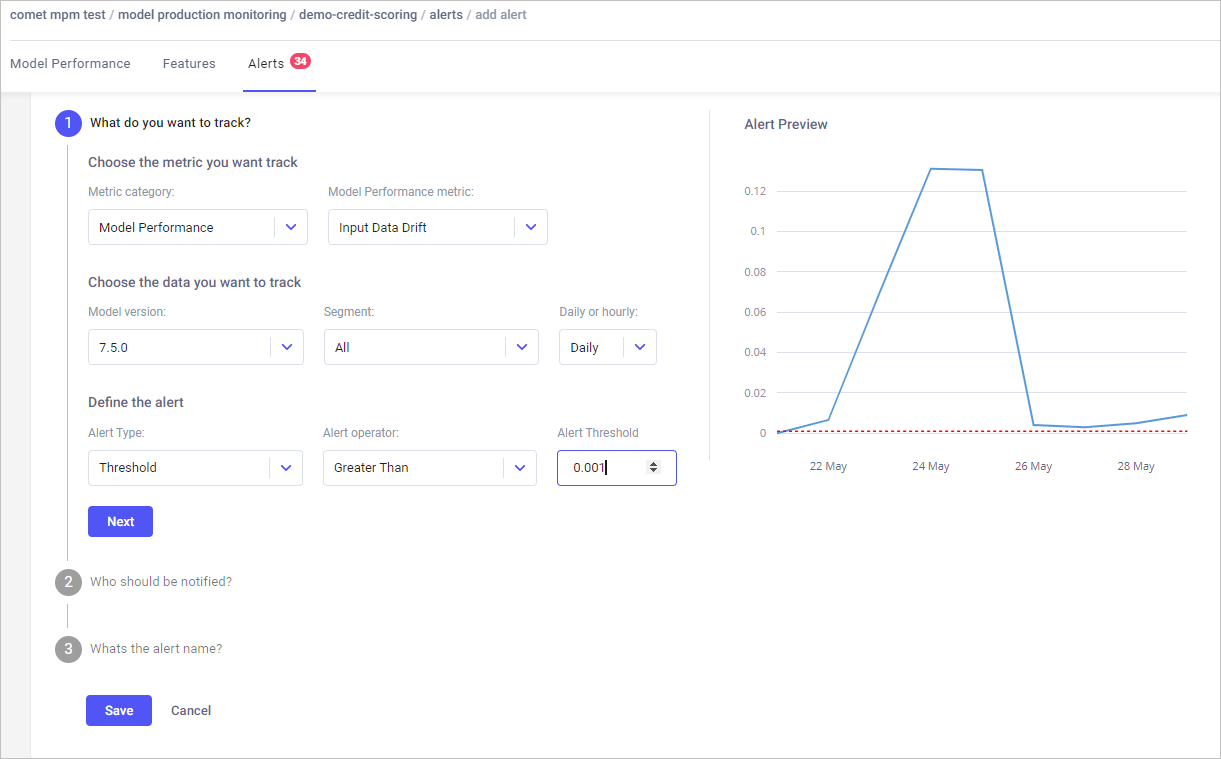
- Add details as required.
- Click Next to view successive windows.
- Click Save when you are done.